Subplots / Tiled plots#
There are three ways to create subplot layouts with Plopp:
Using the in-built
tiledfunctionalityUsing manually created Matplotlib axes
Placing figures inside container widgets
The first two methods will work with any (static or interactive) backend, while the third will only work with the interactive (%matplotlib widget) backend.
Using tiled:#
 New in version 23.08.0.
Leveraging figure operator overloading#
The fastest way to make simple subplots is to use the + and / operators on the figures you create.
Adding two figures will place them side-by-side, while dividing a figure by another will stack them vertically.
[1]:
%matplotlib inline
import plopp as pp
import matplotlib.pyplot as plt

p1 = pp.data.data1d().plot()
p2 = pp.data.data2d().plot()

p1 + p2
[1]:

[2]:
p1 / p2
[2]:

[3]:
(p1 + p2) / (p2 + p1)
[3]:

More complex configurations#
While the figure operators are using tiled under-the-hood, it is also possible to use tiled directly.
Its use is based on Matplotlib’s GridSpec.
[4]:
tiled = pp.tiled(nrows=1, ncols=3)
tiled[0, :2] = p1
tiled[0, 2] = p2
tiled
[4]:

Using Matplotlib axes#
[5]:
%matplotlib inline
import plopp as pp

da = pp.data.data3d()
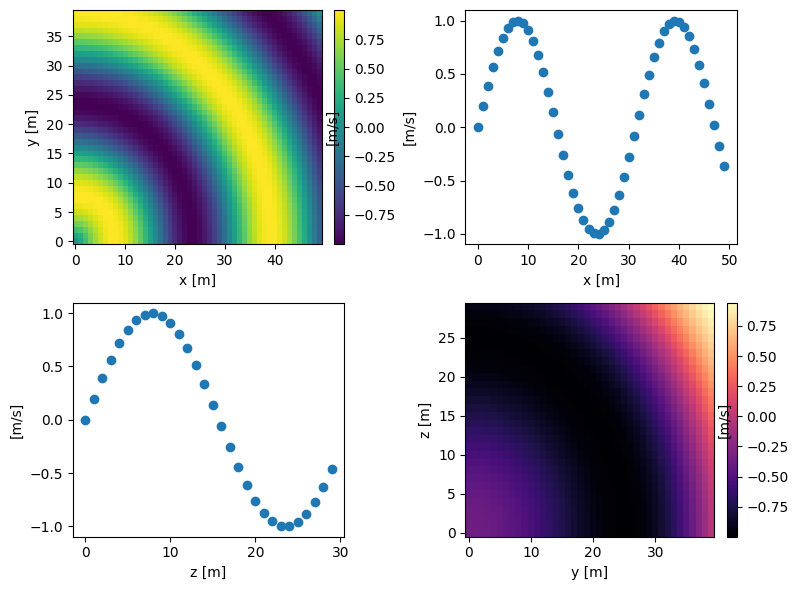
To create our subplots, we use Matplotlib’s in-built plt.subplots function. We then pass each subplot axes to Plopp’s plot function as the ax argument:
[6]:
fig, ax = plt.subplots(2, 2, figsize=(8, 6))

p1 = pp.plot(da['z', 0], ax=ax[0, 0])
p2 = pp.plot(da['z', 0]['y', 0], ax=ax[0, 1])
p3 = pp.plot(da['x', 0]['y', 0], ax=ax[1, 0])
p4 = pp.plot(da['x', -1], cmap='magma', ax=ax[1, 1])

# Matplotlib's utility to optimize spacing between subplots
fig.tight_layout()
Using container widgets#
When the interactive backend is in use, each figure is a widget that can be placed inside other ipywidgets for controlling the layout. In this case, each subplot will have its own toolbar.
[7]:
%matplotlib widget
import ipywidgets as ipw
Given four plots
[8]:
subplot_size = (4, 3)

p1 = pp.plot(da['z', 0], figsize=subplot_size)
p2 = pp.plot(da['z', 0]['y', 0], figsize=subplot_size)
p3 = pp.plot(da['x', 0]['y', 0], figsize=subplot_size)
p4 = pp.plot(da['x', -1], cmap='magma', figsize=subplot_size)
we can create a figure with subplots using
[9]:
ipw.VBox([ipw.HBox([p1, p2]), ipw.HBox([p3, p4])])
[9]:
Plopp actually provides a Box widget as a shorthand for combining ipw.VBox and ipw.HBox:
[10]:
from plopp.widgets import Box

Box([[p1, p2], [p3, p4]])
[10]:
Warning
When using ipw.VBox or Box, alignment of axes is not ensured. This method for creating subplots is applicable for quickly creating interactive interfaces, but we do not recommend it for publication purposes.
Subplots with 3D scatter plots#
The three-dimensional visualizations in Plopp do not use Matplotlib, but Pythreejs. Consequently, it is not possible to insert a three-dimensional scatter plot inside a subplot made of Matplotlib axes. The only way to make a three-dimensional view part of subplots is to use the container widgets described above.
[11]:
da1 = pp.data.data1d()
da2 = pp.data.scatter()

p1 = pp.plot(da1)
p2 = pp.scatter3d(da2, x='x', y='y', z='z', figsize=(550, 400))

Box([p1, p2])
[11]: