Ctrl+K
Plopp - Home Plopp - Home
  • Getting started
  • Plotting
  • Custom figures
  • Gallery
    • API reference
    • Development
    • About
  • GitHub
  • PyPI
  • Conda
  • Scipp
  • Getting started
  • Plotting
  • Custom figures
  • Gallery
  • API reference
  • Development
  • About
  • GitHub
  • PyPI
  • Conda
  • Scipp

Section Navigation

  • Interactive histogramming
  • Masking a range
  • Rectangle selection
  • 3-D scatter plot with threshold
  • 3-D scatter plot with slider
  • Interactive masking
  • Peeling off the layers
  • Tiled random sample histograms
  • Polar plots
  • Updating scatter points
  • Streaming events to a plot

This Page

  • Show Source
  • Gallery

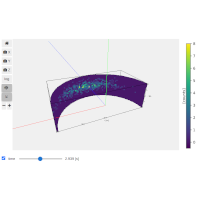
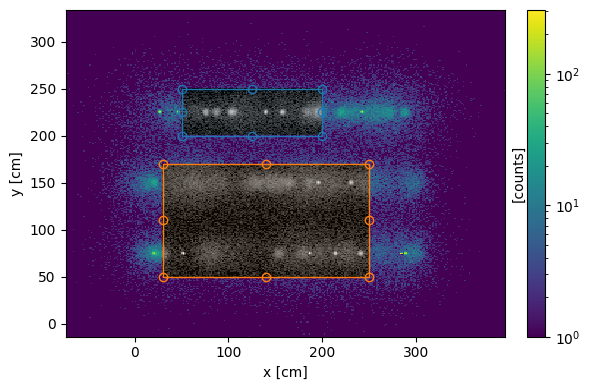
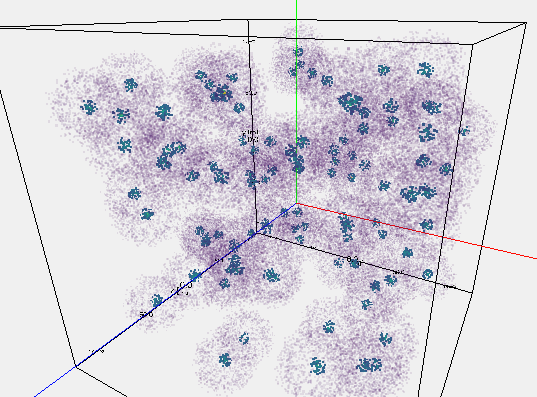
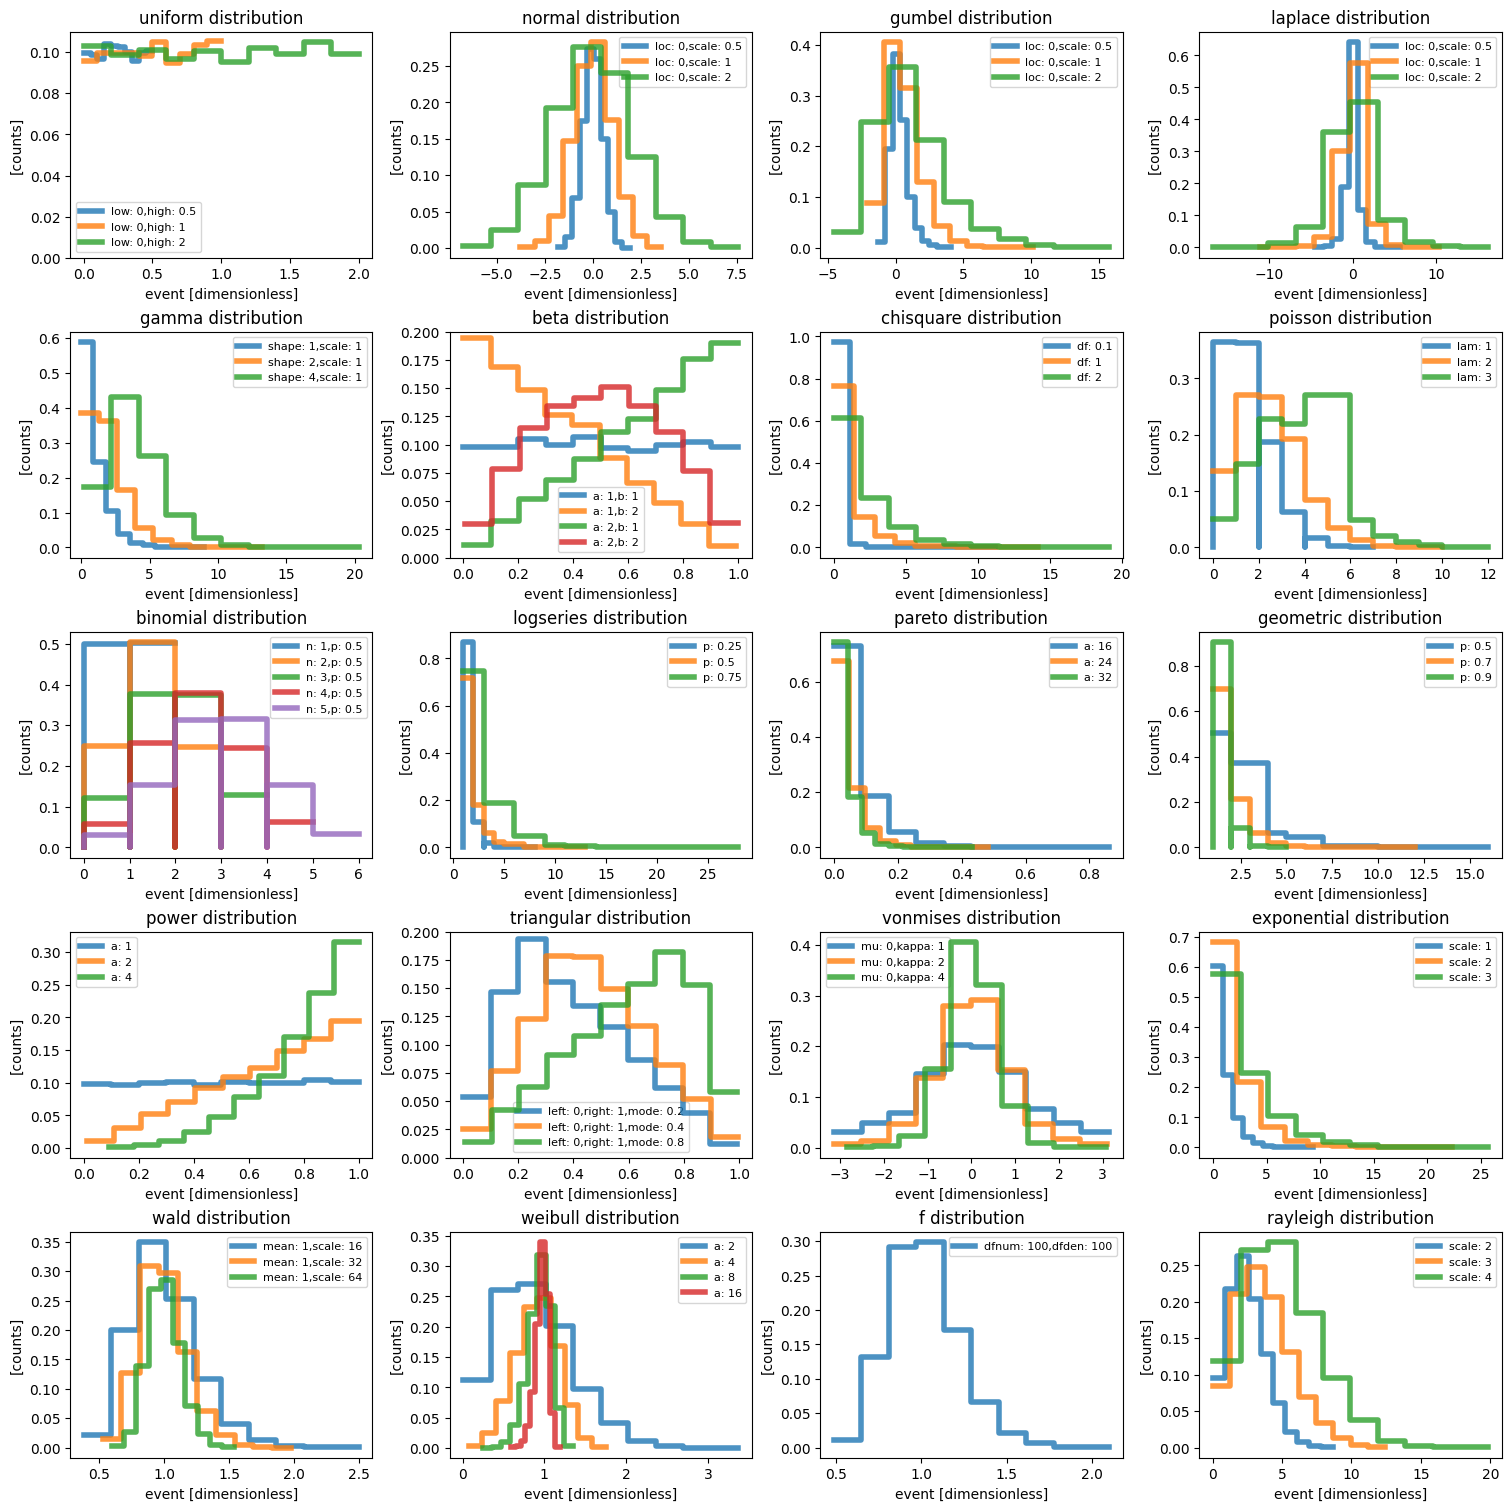
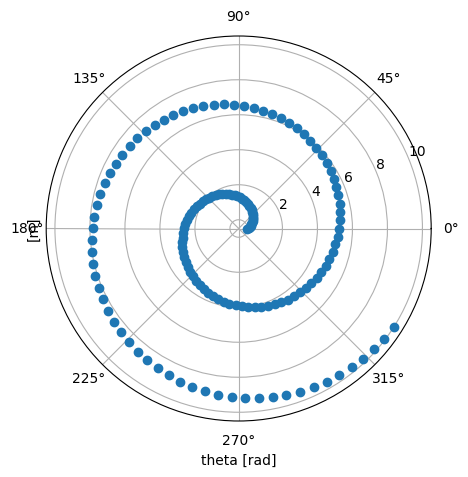
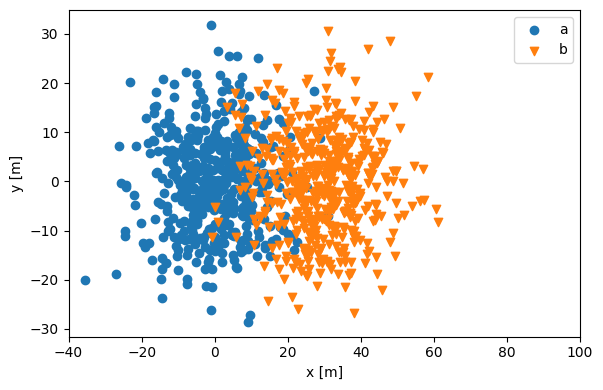
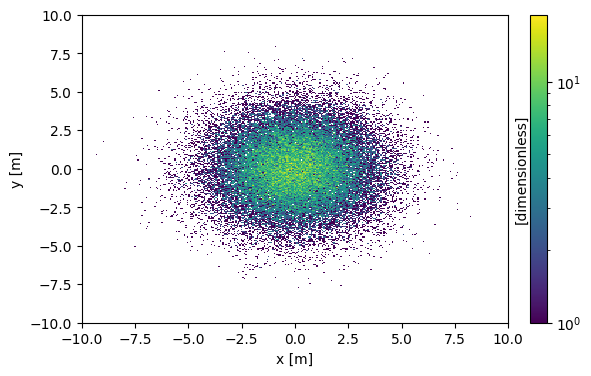
Gallery#

Interactive histogramming
Masking a range
Rectangle selection
3-D scatter plot with threshold
3-D scatter plot with slider
Interactive masking
Peeling off the layers
Tiled random sample histograms
Polar plots
Updating scatter points
Streaming events to a plot

previous

Graph and node tips

next

Interactive histogramming

© Copyright 2025 Scipp contributors.

Created using Sphinx 8.1.3.

Current Plopp version: 25.5.0 (older versions).

Built with the PyData Sphinx Theme 0.16.1.